Ever since I wrote a complete Baltic Equities Market Overview, I dreamed of writing similar at least once each quarter. Then each half-year and it seems, I won’t have an opportunity for the next several years.
Partly because my eyes are on more markets, more individual equities. Secondly, since I quit, I started building a new career from scratch, which again is a tough time bargain.
So hopefully this new format of stocks portfolio overview (fewer positions, more individual benefit) will catch on. I keep posting portfolio updates, but never really talked about all my equity portfolio positions comprehensively, which was on my mind for over a year now. So here it is.
Current Stocks Portfolio Structure
Just to remind, what’s inside. At 2020.01.03 closing prices (all the rest latest data will be based on the same date) current stocks value portion in the portfolio:
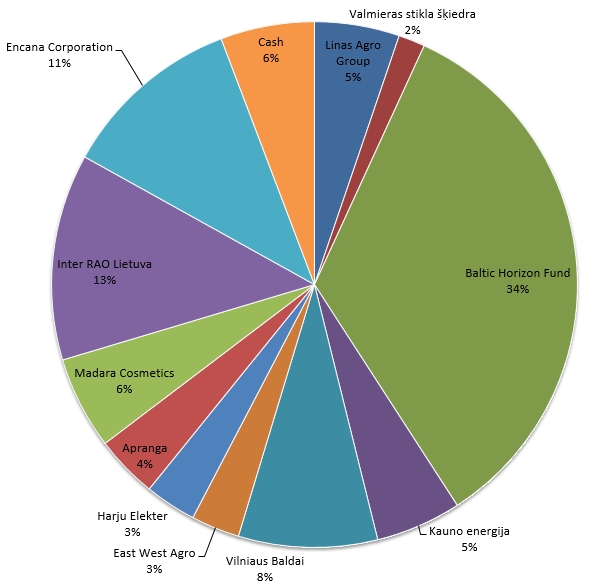
I’ll follow the historical acquisition order, not the weight.
Linas Agro Group (Ticker: LNA1L)
Linas Agro Group is the oldest position in portfolio. Acquisition dates and prices range from 2013.05 to 2014.10 and 0.671 to 0.705 accordingly. Weighted position performance (including dividend) in portfolio is -11.4%.
LNA1L Shares Historical Performance
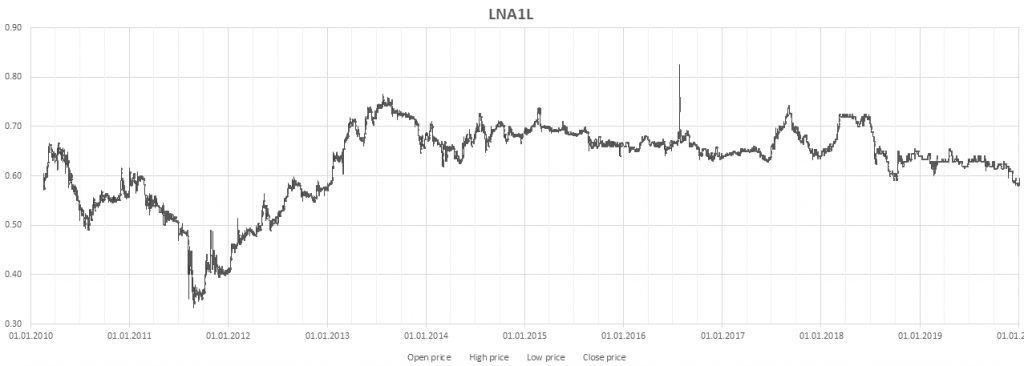
TradingView has distorted history view for some reason… Pitty. Current Market Capitalization: 94.57 Million EUR
Linas Agro Group Facts in Numbers
LNA1L Financial Ratios
At 0.595 last session closing price current financial ratios and audited FY 2018-2019 report:
- EV/EBITDA: 42.7
- P/E: -19.8
- P/tBV: 0.6
- Debt/Equity: 1.3
- Net Debt/EBITDA: 25.5
- FCF/Market Cap: 7.3%
- Cash/Market Cap: 8.1%
LNA1L Financial Performance
Linas Agro Group revenue history:

Older investors should know, that after IPO in 2010, the company has expanded horizontally and most of the acquisitions were made below book value, which translated into huge profits from 2011 to 2013.

Normalized historic profits:

Commentary on Linas Agro Group Financials and Position
I have to admit, I might have fallen into the love trap as an investor with LNA1L. Returns have been unsatisfactory, and I would have to think harder to come up with the reason why I am a shareholder of Linas Agro Group. But I can try.
- The huge hidden value in own land valuation;
- From 2012 to 2019, major shareholder increased its position from 65.9% to 79.9%;
- Excellent reputation as an employer and in agro sector circles as a partner;
- Among a lot of local competitors, the strongest financial position, which means, it will outlast low margin battle and come through stronger;
- Recent 3 years in a row have been difficult for the agricultural sector as a whole;
- Asset Management Group Invalda supports hidden value thesis and has acquired a stake in LNA1L last year;
- Growing diversification, proven track record of investments made.
That’s why I probably won’t sell LNA1L like… ever.
Notes from 2019 October Linas Agro Group AGM of Shareholders
- 20M EUR Assets impact under IFRS16;
- LNA1L admits trading crops mistakes and that measures have been taken not to trade at a loss in the future again;
- A 3-year streak of bad weather has significantly impacted a lot of firms inside the region and in Scandinavia. Possible acquisitions this FY. Financing – party own assets, party bank;
- Relations with banks are good, mutual understanding of temporary weather season impact;
- Feels confident in balance sheet among peers;
- Investments in Latvia mainly done.
Valmieras stikla šķiedra (Ticker: VSS1R)
I acquired Valmira Stikla Skiedra in November of 2015 at price of 3.25€. Today this translates into hurtful position performance (including dividend) of -62.5%.
VSS1R Shares Historical Performance
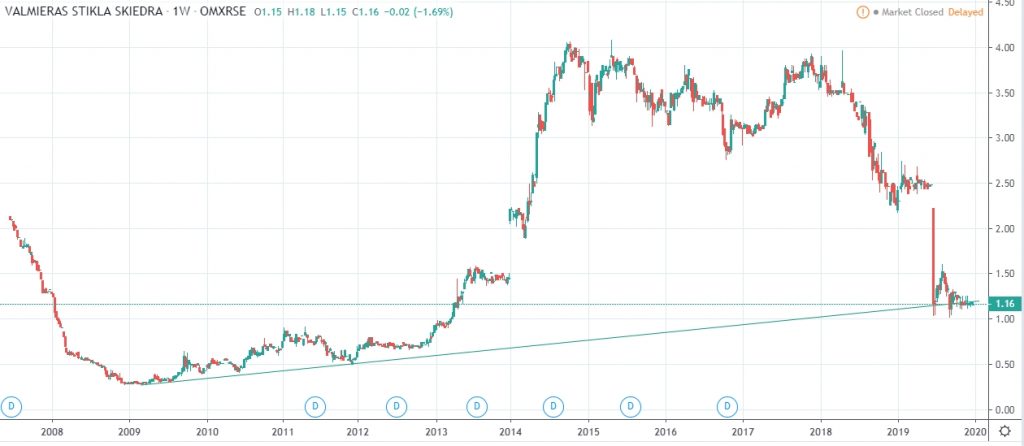
Current Market Capitalization: 27.7 Million EUR
Valmiera Stikla Skiedra Facts in Numbers
VSS1R Financial Ratios
At 1.16 last session closing price current financial ratios and 2019 H1 ttm report:
- EV/EBITDA: -0.8
- P/E: NOT GOOD AT ALL
- P/tBV: -0.5
- Debt/Equity: -3.44
- Net Debt/EBITDA: NOT GOOD AT ALL
- FCF/Market Cap: -68.3%
- Cash/Market Cap: 4.2%
VSS1R Financial Performance
Valmiera Stikla Skiedra revenue history:

Ah the failed expansion in US…

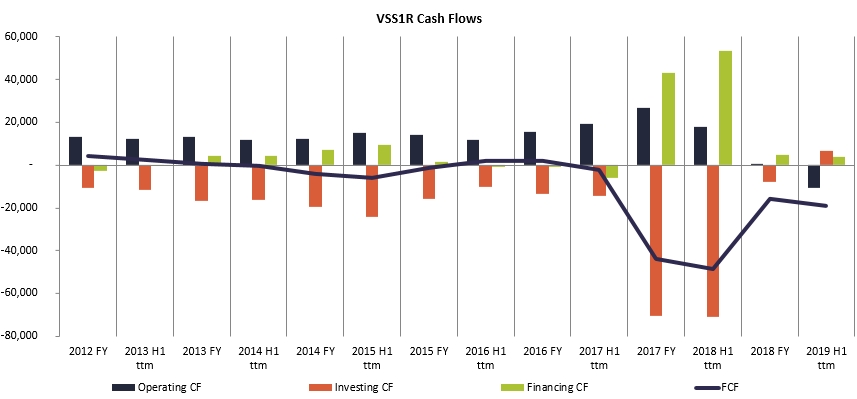
Horrific balance sheet…

Historic cash flows:
Commentary on Valmiera Stikla Skiedra Financials and Position
I have had mentioned before, that I keep switching from closely monitoring stocks, to … not in short. At nearly every stage of VSS1R demise, there was wishful thinking things will eventually start up with US plant and things will turn around into huge growth. Product is good. Glass Fibre Market is growing; Demand is there. VSS1R is a strong player. Not so strong in launching new plants I suppose.
Lack of attention + wishful thinking was the story of this. I mean, how often do major shareholders (German industrial expertise) fail with their investments?
- High indebtedness level in 2016-2017 -> Fueling Expansion in US;
- Unexpected start challenges -> wishful thinking of temporary problems (usual case)
- Persistent failures to launch (major shareholders’ support) -> will start eventually and start bringing new profits home…
Not so much. Audited 2018 FY report was late for nearly a year. Information in webinars suggests the bottom was found. The position is not big after all. I would consider buying at this bottom, but there are far more attractive deals.
Baltic Horizon Fund (Ticker: NHCBHFFT / NHCBHFFS)
I have presented Baltic Horizon investment thesis before. Indeed it was a great opportunity to grab a higher yield. I occasionally “trade” Baltic Horizon REIT Fund. Currently acquisition dates range from 2016.10 to 2019.10, prices: 1.25 -1.35. Weighted position performance (including dividend) in portfolio is +11.6%.
NHCBHFFT Fund Units Price Historical Performance
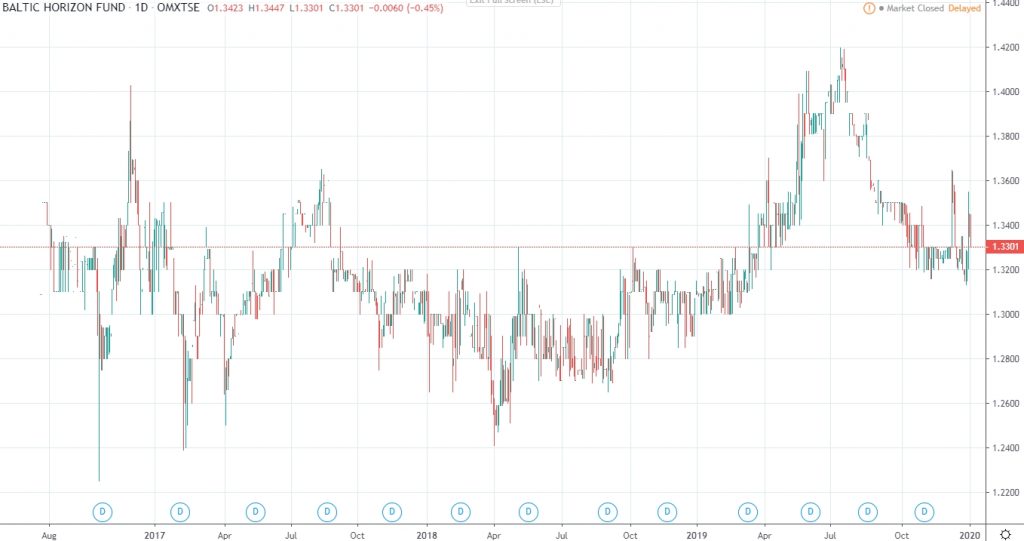
Current Baltic Horizon’s Market Capitalization: 134.2 Million EUR. It’s safe to say, price is mainly driven by dividend yield.
Baltic Horizon Fund Facts in Numbers
Now I will be honest with you. I look at reports from time to time, participate or watch later each of webinars, ask questions during Q&A or via email if I have something on my mind, but unfortunately I do not track Fund’s financials the same granularity I do for equities.
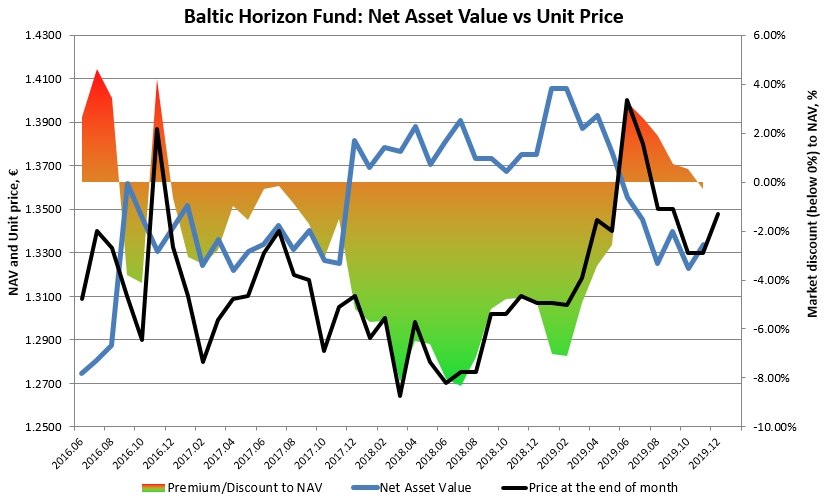
In the aforementioned Fund’s review I wrote, I displayed dividend and NAV discount/ premium graphs, I do track those. At 1.330 last session closing price they are:
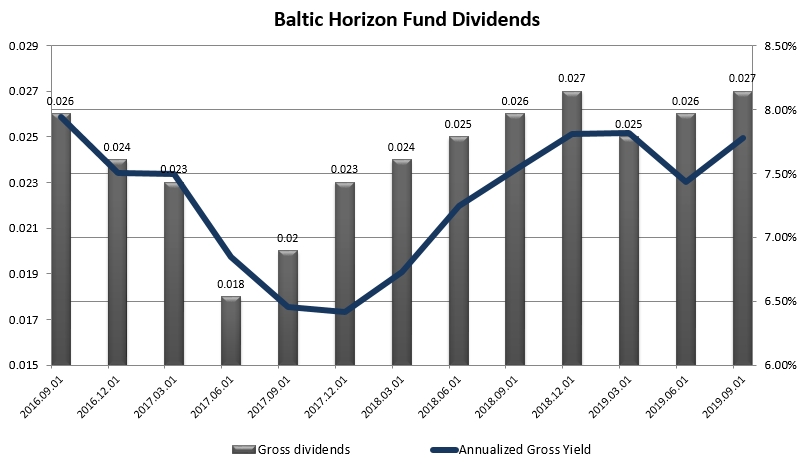
Trailing twelve months dividend yield and Fund’s historic dividends:
Commentary on Baltic Horizon Fund Financials and Position
Before IPO, management has proclaimed the fund will aim to manage assets worth 1 Billion EUR. In 2019 9 months report, total assets amount to 345.3 Million Eur, which is growing each year.
Investors might be worried about dilution of share capital and questionable rate of dividend growth, but from all the capital raising issues fund has already made (were plenty), only one has been to unitholders disadvantage.
As seen from the top graph, for the most trading history, fund units have been traded below Net Asset Value (NAV), which meant any new capital raising was beneficial to current unitholders (issue price is always at the last available NAV).
Last Debt/Equity ratio is 1.55 and is within management’s target leverage.
Baltic Horizon: Economies of Scale
The big take-away from last few webinars have been focus on gaining traction in economies of scale.
Any new brand entering a Baltic region will be very very happy to know, there is a one-stop solution (Baltic Horizon Assets) to enter all Baltic Capital Cities, central areas at the same time.
Cost of borrowing is another huge thing. You couldn’t see this now, but bond issue at premium coupon, than it would have gotten from bank loan is an investment into the future. There might come a time when the market is full of great deals and bank doors are shut. Anyway, the larger the fund, the cheaper cost of borrowing in the future, which translates into savings, that will be directed to the dividend. I’m fond of this long-term thinking.
I wouldn’t discard the possibility of fund’s sale to international players when significant scale is reached. At far a greater price, of course, that is. This takes a birds-eye view of the region: growing tourism, integration to Scandinavian – Western Europe. Someday Baltic Region to the US will be part of Europe, not ex-soviet states mental picture. With that, comes dividend yield contraction to western standards.
Baltic Horizon Position in Portfolio
Trading activity in the market has grown substantially since I first entered the position in 2016.07. Investor sentiment and fuss (visibility, talks among fund managers) has also grown incomparably.
From the very start I had a thesis, that 6.5 – 7% Net Dividend Yield won’t go unnoticed. Increased trading volumes are ok, but I’m puzzled by consistently attractive yield. For the better… This gap will eventually close. Until then, that’s a great safe haven to wait for the market to pop.
In a deflationary scenario, the only loss for the fund is NAV, which is based on expected cash flows (slight decrease, which has been seen in 2019 summer (see the first graph).
In inflationary scenario – lease contracts are indexed with CPI, which would increase rental income.
In recession scenario – vacancies would perhaps increase (even though this is premium class, and tenants are strongest), which would reduce rental income and dividend yield, but it’s still better than businesses going belly up. Growing regional capital cities and assets in the heart of them are worth it.
Kauno Energija (Ticker: KNR1L)
I bought Kauno Energija in May of 2017 at price of 0.706€, the day after ~15% yield dividends were proposed. Today (including dividend) position stands at +71.1% in portfolio.
KNR1L Shares Historical Performance
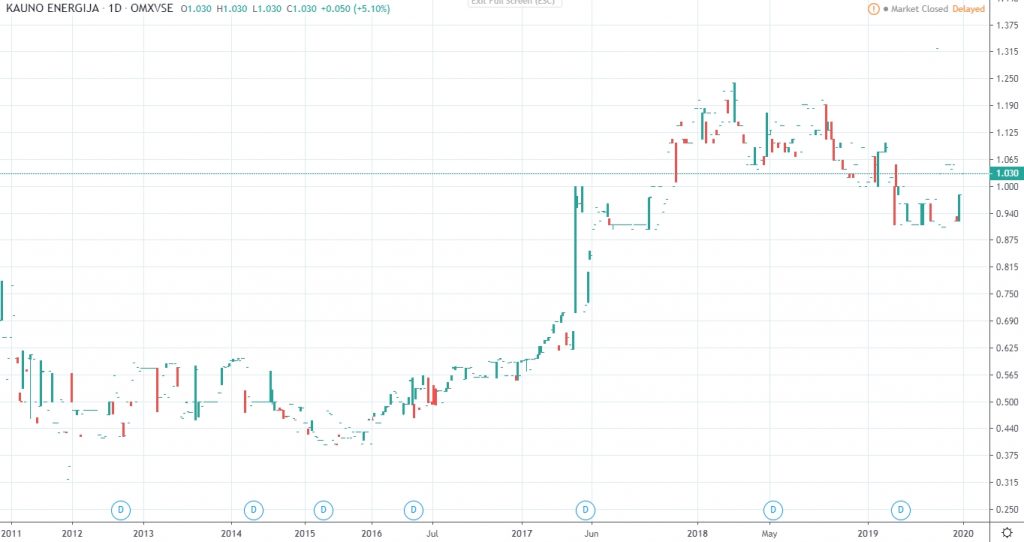
Current KNR1L Market Capitalization: 44.0 Million EUR. Can you see that liquidity..?
Kauno Energija Facts in Numbers
KNR1L Financial Ratios
At 1.03 last session closing price current financial ratios and 2019 H1 ttm report:
- EV/EBITDA: 5.5
- P/E: 48.9
- P/tBV: 0.5
- Debt/Equity: 0.64
- Net Debt/EBITDA: 1.25
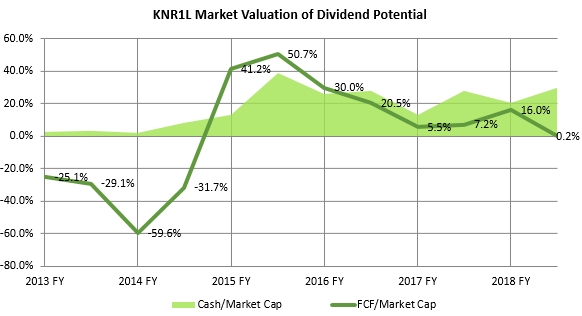
- FCF/Market Cap: 0.2%
- Cash/Market Cap: 30.1%
KNR1L Financial Performance
Kauno Energija revenue history:

A slight contraction in profits, but pretty stable

Cash flows history:
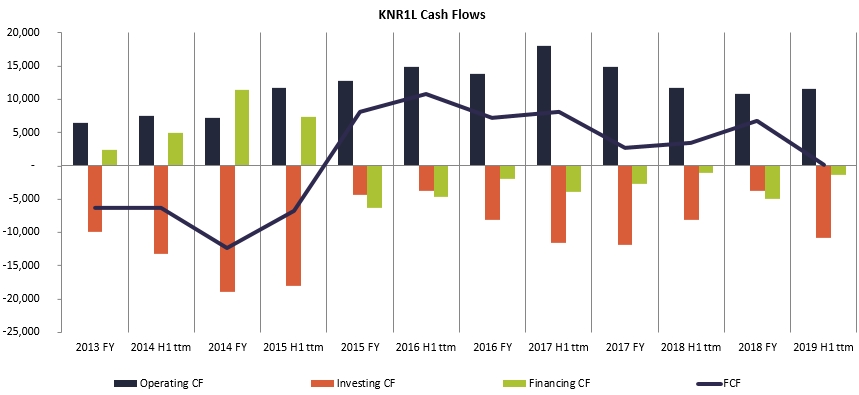
For each share of 1 EUR, investor gets 30 EUR cents of Cash lying around in the Balance Sheet:
Commentary on Kauno Energija Financials and Position
The sector is good, company is cheap, liquidity is bad, management? Yet to meet, last year AGM coincided with Inter RAO Lietuva meeting, it I was willing to look at folks there.
The main problems are three:
- Liquidity. Killer…
- Climate change, warmer winters and less demand for heat.
- High competition among independent heat producers in Kaunas, driving prices down (good for Kaunas residents though).
I intend to visit the annual meeting of shareholders and then decide whether to stay in this position.
Vilniaus Baldai (Ticker: VBL1L)
I acquired Vilniaus Baldai between 2017 June and 2017 August at price of 13 EUR. Position performance (including dividend) in portfolio is -37.7%.
VBL1L Shares Historical Performance
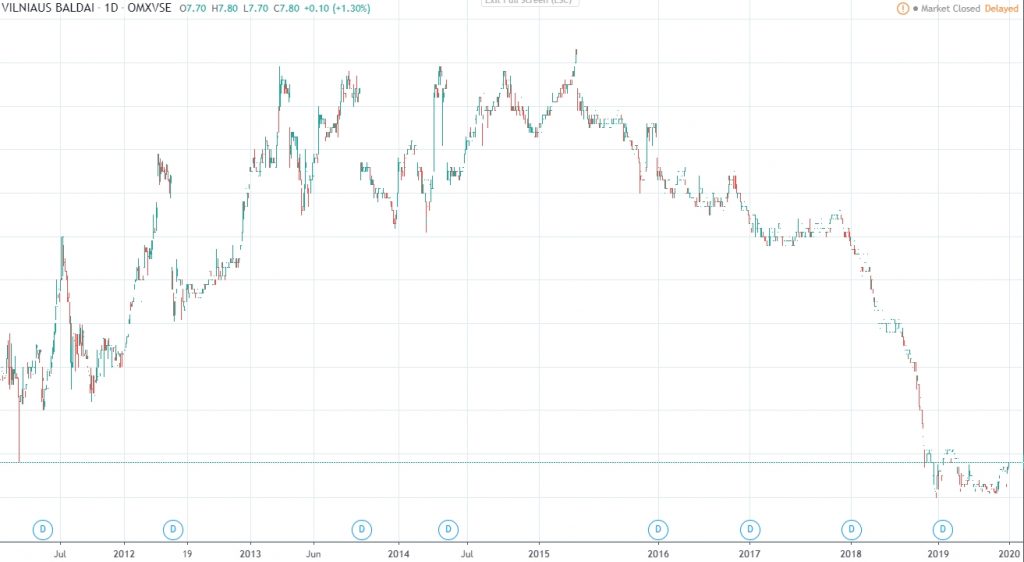
Current Market Capitalization of Vilniaus Baldai: 30.3 Million EUR.
Vilniaus Baldai Facts in Numbers
VBL1L Financial Ratios
At 7.80 last session closing price current financial ratios and audited FY 2018-2019 report:
- EV/EBITDA: 11.8
- P/E: 12.5
- P/tBV: 1.5
- Debt/Equity: 1.94
- Net Debt/EBITDA: 4.53
- FCF/Market Cap: -60.4%
- Cash/Market Cap: 8.1%
VBL1L Financial Performance
Vilniaus Baldai Revenue history:

Q4 of the last FY result was impacted by one-off of the real estate sale. Normalizing it:

Normalized historic expenses, EBITDA margin dynamics and historic margins:

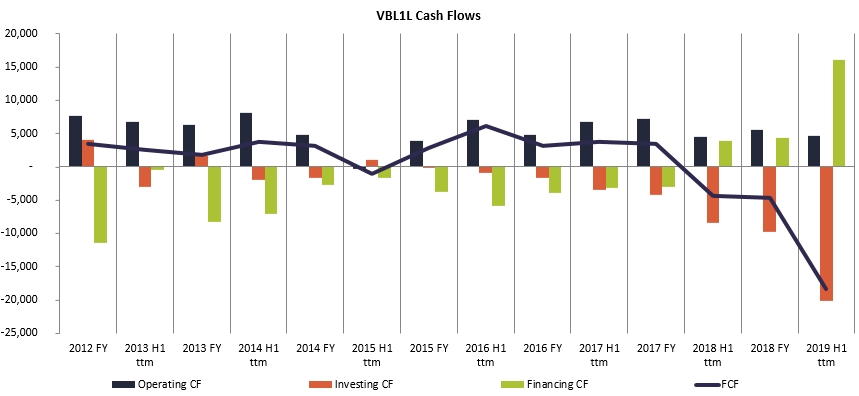
This is clearly a bottom in the company’s financials, and it was confirmed in AGM. New plant in Trakai region construction is clearly visible in cash flows:
Commentary on Vilniaus Baldai Financials and Position
It’s hard on your ego to admit you have failed. The mind plays tricks in all sorts of ways. In a way, it’s beautiful to observe. When I acquired a stake in Vilniaus Baldai, I expected dividend payouts to return to historic averages, but that was not the case, later came the expansion and so far it looks like it will be nothing like VSS1R case in the US.
I slept on this position the same way management admitted it did too in the last few years. Again, stock has found the bottom, I’m pretty confident about that. Last reported Q1 Net profit and EBITDA results (no one-offs) were x3.75 and x2.5 YoY. But investors need time to trust the company to deliver again.
Notes from 2019 December Vilniaus Baldai AGM of Shareholders
- Contract with IKEA for 5 years of sales was necessary for bank loan contracts only;
- Long term goal – no/minimum debt;
- Construction in Trakai – ahead of time, new equipment already on the way;
- Once move to new facilities are completely done, Vilniaus Baldai intends to sell owned PPE (Property Plant and Equipment) in Vilnius;
- Sees the rest of Lithuanian Furniture Producers as partners, not as competitors (confirmed outlook by the Vakaru Medienos Grupe CEO). Named competitors are Portugal, US. “Regional hubs IKEA strategy”
- Vilniaus Baldai produces honeycomb filled furniture (only among Lithuanian peers) nearest competitor – in Poland, plant owned by IKEA;
- More complex (children furniture) and lighter (transportation costs) product line.
- Economic slowdown is not an issue for IKEA (consumer tends to select cheaper (IKEA) products), and thus its supply chain (VBLL) (did not peek at IKEA’s 2006-2013 financials);
- Average 0.5M EUR Capex to maintain equipment (near depreciation levels, discarding the new Trakai plant;
- 5-8% “allowed” Net Profit margin by IKEA;
- Favorable wood prices at the moment; Lagg of 2-3 months in the market to reach COGS line;
- Next quarters’ performance should return to historic profitability margin averages.
East West Agro (Ticker: EWA1L)
I acquired East West Agro in January of 2018 at the price of 21.6 EUR (Before changes in share capital). Position performance (including dividend) in portfolio is -48.1%.
EWA1L Shares Historical Performance
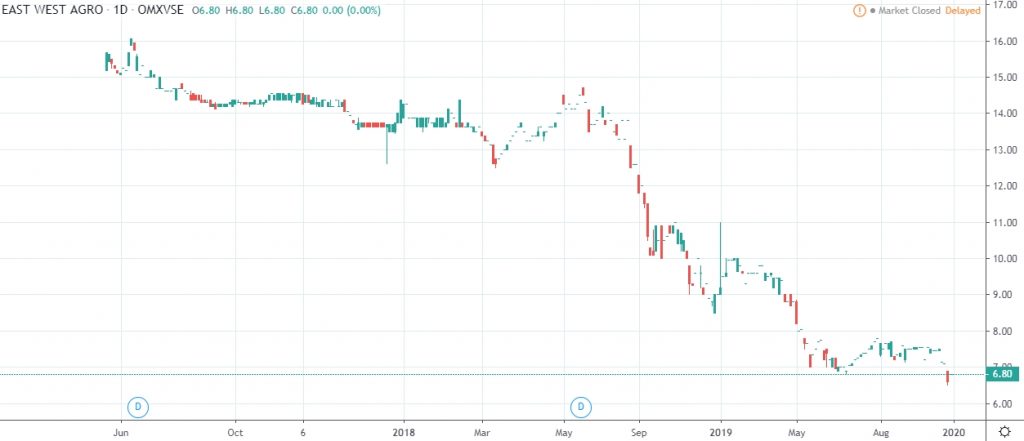
Current Market Capitalization: 6.8 Million EUR.
East West Agro Facts in Numbers
EWA1L Financial Ratios
At 6.80 last session closing price, current financial ratios and non-audited 2019 H1 report for trailing twelve months figures are:
- EV/EBITDA: 19.2
- P/E: NOT GOOD AT ALL
- P/tBV: 1.4
- Debt/Equity: 4.03
- Net Debt/EBITDA: 10.6
- FCF/Market Cap: -60.4%
- Cash/Market Cap: 0.1%
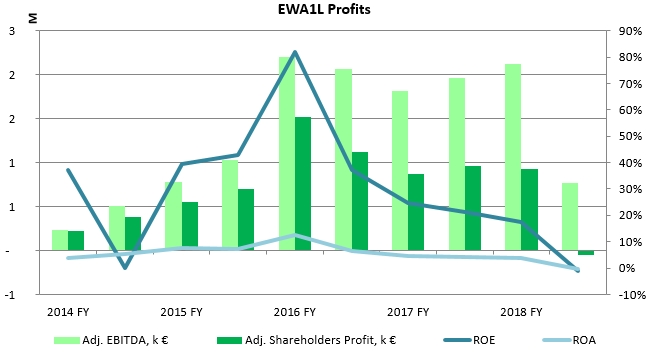
EWA1L Financial Performance
East West Agro Revenues:
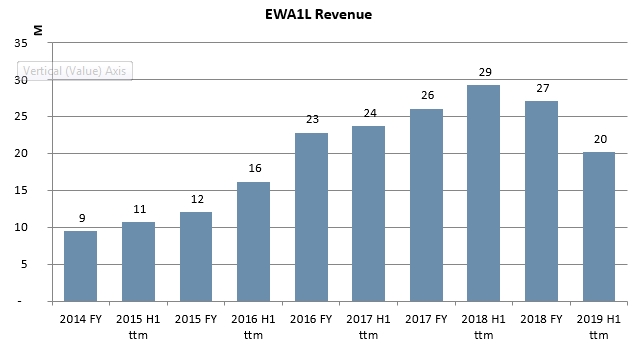
Company is listed in First North market and does not report quarterly figures.
Cash Flows:
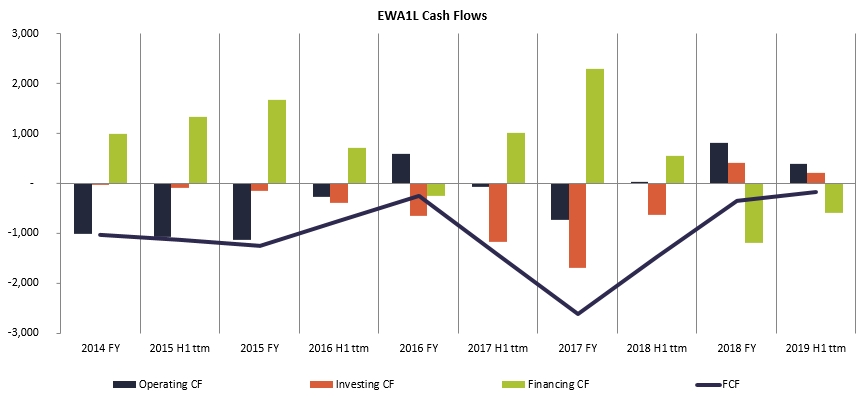
And here’s something scary in the balance sheet:

Commentary on East West Agro Financials and Position
When I wrote about this acquisition I was ambiguous about the reasons, because it wasn’t a cheap bargain on the market. I trusted my friend’s judgment of the company, which he analyzed far more thoroughly than I did.
The main investment thesis for East West Agro company occupied agricultural equipment market share. The dreaded 3 consecutive years in weather conditions had the worst impact of all three regionally listed companies in the sector.
Again, I ignored the weather conditions and future farmers’ willingness to spend on new equipment. East West Agro announced it would look for a strategic investor (which rumor has it) was the primary reason to enter the market in the first place.
Harju Elekter (Ticker: HAE1T)
I bought into Harju Elekter in 2018 June at 5.24 EUR. Position performance (including dividend) in portfolio is -14.45%.
HAE1T Shares Historical Performance
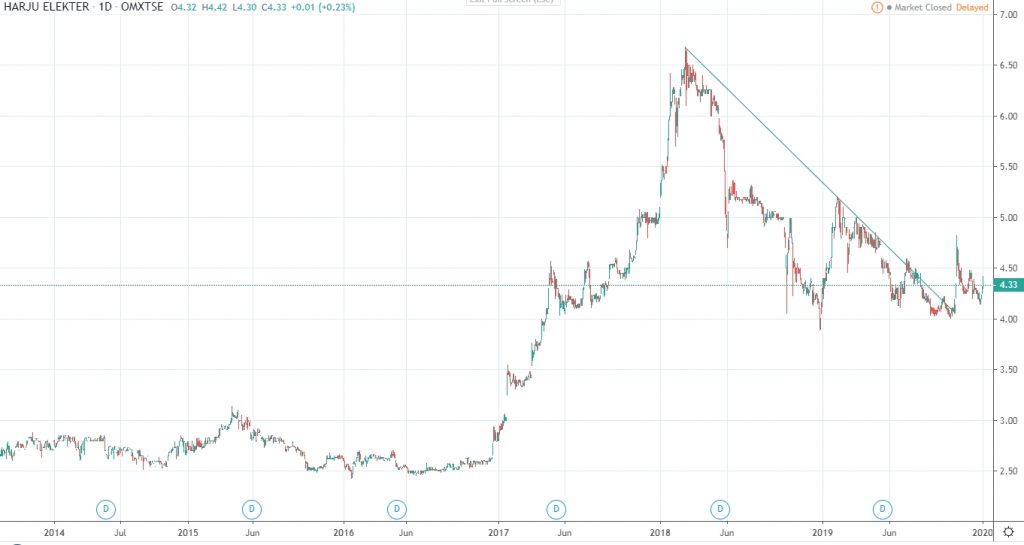
Current Harju Elekter’s Market Capitalization: 76.8 Million EUR.
Harju Elekter Facts in Numbers
HAE1T Financial Ratios
At 4.33 last session closing price, current financial ratios and non-audited 2019 H1 report for trailing twelve months figures are:
- EV/EBITDA: 17.1
- P/E: 56.1
- P/tBV: 1.3
- Debt/Equity: 0.76
- Net Debt/EBITDA: 3.38
- FCF/Market Cap: -3.3%
- Cash/Market Cap: 2.6%
HAE1T Financial Performance
Harju Elekter Revenues:

Haven’t gotten around to adjust net profits for this company for one-off 24.8M of sale of the controlled company in 2017 H1. EBITDA:
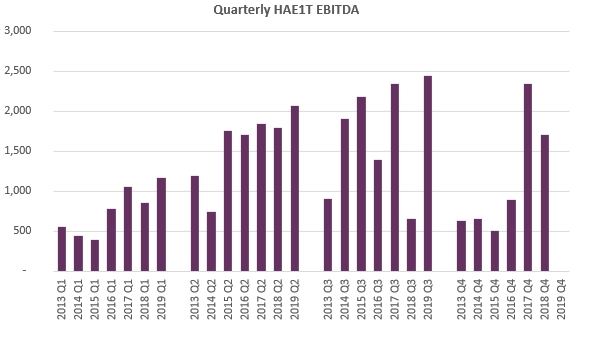
Balance Sheet is stellar though.

Recent developments in Harju’s Cash Flows:
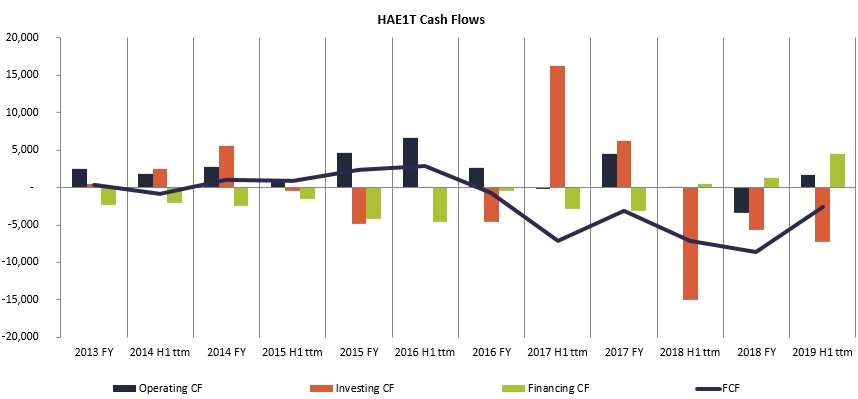
Commentary on Harju Elekter Financials and Position
Things always attract attention when they rally, but I’m not a fan of participating in madness, rather I spend my time understanding why did the company attract retail attention and is it worth buying into during retracements.
Skeleton Technologies
That was the story of this position in my portfolio. I found out it has a 10% stake in Skeleton Technologies, an Estonian – German ultracapacitor manufacturer.
Ever heard of Tesla? Ever heard of its market-leading battery life? Tesla has acquired Maxwell Technologies – an ultracapacitor manufacturer for 218 Million USD in 2019 (55% above its market value).
It seems like Skeleton’s patented curved graphene ultracapacitors beat Maxwell’s performance.
And last year I tweeted, about new IPO-oriented board member in Skeleton.
I won’t even debate how hot the ultracapacitor sector is. Harju has not changed its Skeleton valuation for 3 or 4 consecutive years.
Some trivia:
I’m not selling Harju Elekter until I see true Skeleton Technologies value in Harju Elekter’s balance sheet or stock price.
Harju Company itself
Last Q3 report had excellent results. While Skeleton will realize itself, Harju pays a conservative dividend.
In recent years Harju has pushed itself into Scandinavia to establish itself as reliable partner and I expect margins to increase over time. Wage increase was among the major hurdles squeezing margins, but it won’t grow forever.
The development and technological growth program implemented by the company produces results: sales revenue of $ 7.8 million Eur, is expected to grow to 30 million this year. Eur, likely net profit, 2017 $ 0.29 million Eur, will grow accordingly – to, it is projected, 1, 1- 1.5 mln. Eur.
“We grow twice every year. 2022 turnover will reach 60 million. Euros” says Tomas Prūsas
“Project management is the essence. We use global tools to do this. The task of sales is to bring the customer, the production – to keep it on time, to deliver the service on time, at the agreed budget and the customer would like to come back” emphasizes Tomas.
Over the years, the company has been able to attract customers such as General Electric, G-Power, and Alfa Laval’s orders have grown significantly. The success stories of working with Panevezys are of interest to other divisions of major international companies such as Siemens or Danfoss. And, if the project for the industrial division has been successfully implemented, there is a high probability of getting an order from the offshore division. They are calling for expansion, and some partners are considering closing factories and relocating production to Panevezys – making it more convenient and cheaper for them to make their own.
Five years ago, UAB Rifas was the smallest company in the Harju Elekter group – after a few years, the company aspires to become the largest.
vz.lt
Apranga Group (Ticker: APG1L)
I purchased Apranga Group in October of 2018 at price of 2.14 EUR. Current position performance (including dividend) in portfolio is +3.76%.
APG1L Shares Historical Performance
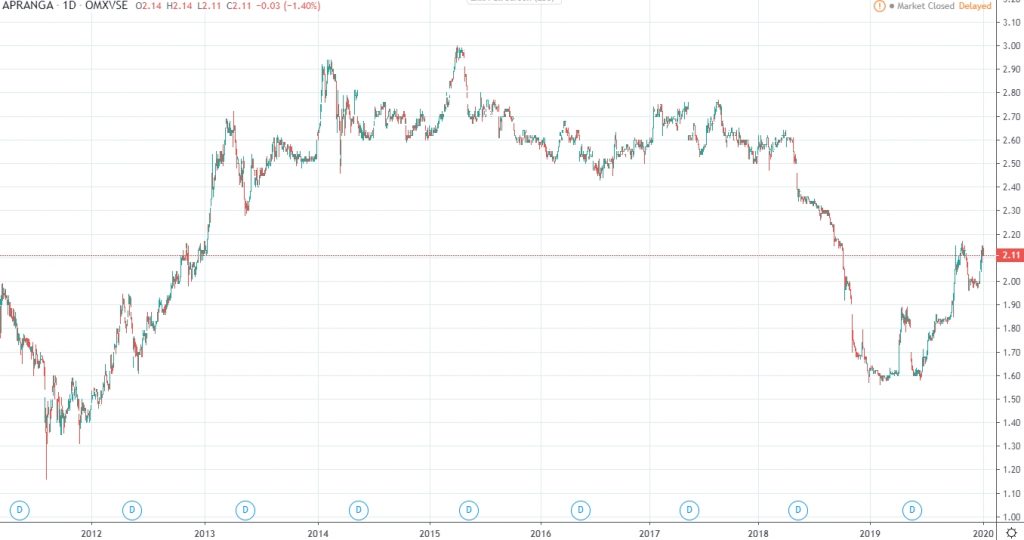
Current APG1L Market Capitalization: 116.6 Million EUR.
Apranga Group Facts in Numbers
APG1L Financial Ratios
At 2.11 last session closing price current financial ratios and non-audited 2019 H1 report for trailing twelve months figures are:
- EV/EBITDA: 7.9
- P/E: 13.9
- P/tBV: 2.2
- Debt/Equity: 1.64
- Net Debt/EBITDA: 2.79
- FCF/Market Cap: 3.2%
- Cash/Market Cap: 2.7%
APG1L Financial Performance
Apgranga Group revenue history:

Note, that quarterly figures were not adjusted for one-off sale of real estate in 2017 Q3.

Apranga also faces the inevitable rising wages pressure for quite some time, but management and investments in progress seem to have a positive impact.
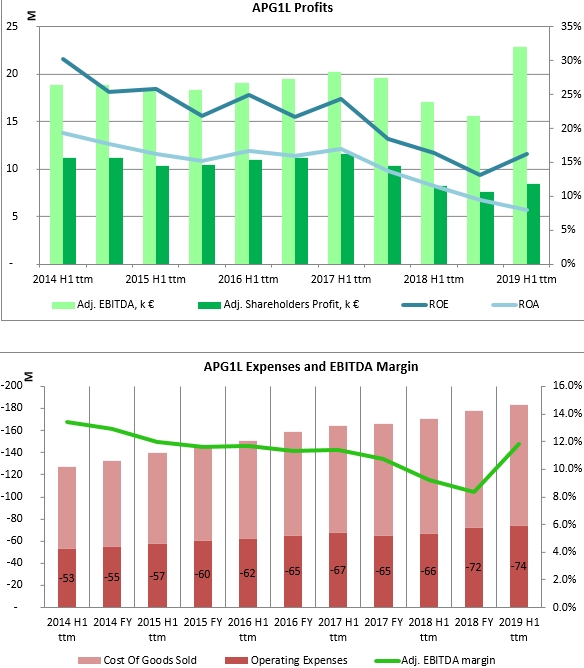
Commentary on Apranga Group Financials and Position
I am more shameful about the failure of the initial evaluation of Apranga than I am of other positions’ negative performance. I note, that I have reduced APG1L on the way down, but did not repurchase, even though insiders have been loading on heavily.
It’s probable I have some biases against the retail sector and consumerism in general, however I do track Pandora AS stock on the other hand.
CEO R. Perveneckas has warned about potential steep decline in 2019 Apranga Group revenues, but the company must have superb management and leveraged reconstruction and growth successfully.
I’ll wait for the proposal for 2019 dividend and decide then. Generally, I don’t want to be in Apranga Group and consider entering position a mistake in the first place.
MADARA Cosmetics (Ticker: MDARA)
I added Madara (linked the blogpost already) a little less than a year ago at the price of 7.75€. Current position performance (including dividend) in portfolio is +1.96%.
MDARA Shares Historical Performance
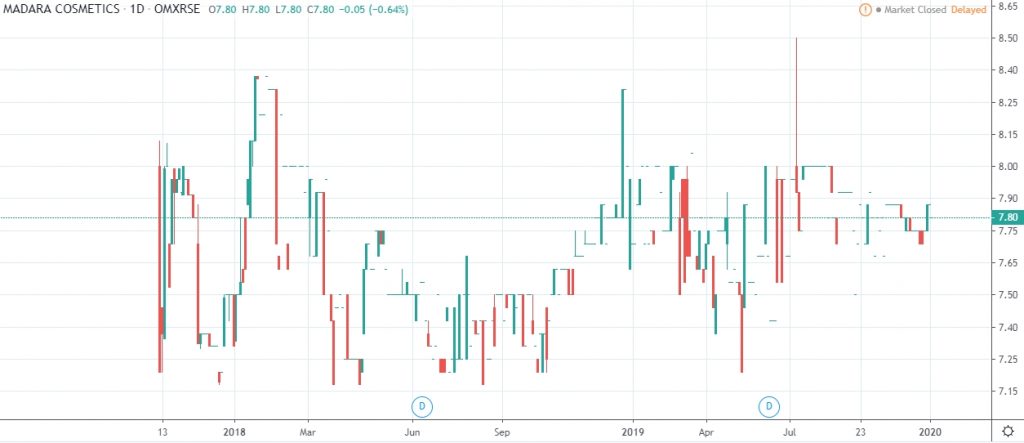
Current Madara Cosmetics Market Capitalization: 29.2 Million EUR. Another liquidity superstar.
Madara Cosmetics Facts in Numbers
MDARA Financial Ratios
At 7.80 last session closing price current financial ratios and non-audited 2019 H1 report for trailing twelve months figures are:
- EV/EBITDA: 14.0
- P/E: 22.0
- P/tBV: 3.5
- Debt/Equity: 0.19
- Net Debt/EBITDA: -1.50
- FCF/Market Cap: 0.0%
- Cash/Market Cap: 10.3%
MDARA Financial Performance
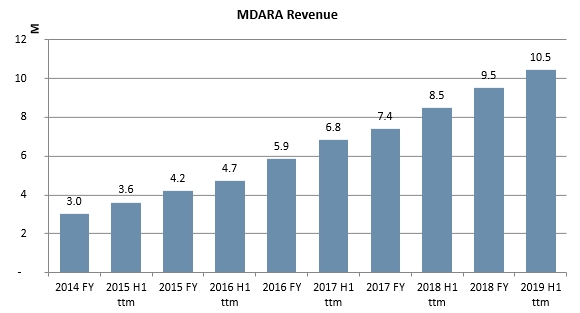
Madara Cosmetics revenue history:
Expenses and declining margins:

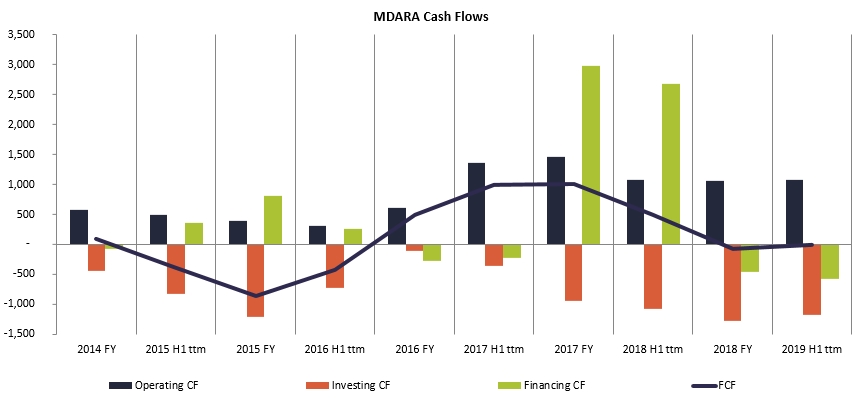
Cash flows below show latest investments into new product lines; two spikes in positive financing are the capital issue.
Commentary on Madara Cosmetics Financials and Position
I did expect a faster turnover growth in the last report, but management expects guidance (15M EUR in 2020) to be achieved as of today.
Profits stumble to keep up, but this is partly offset by market entry and marketing costs for new products. Generally, returns have been minimal, but strong balance sheet, excellent corporate governance, and sustainability trends are the things holding me onto the stock.
I would note, (and there was a question in one of the webinars) that company could use the leverage to accelerate growth. Currently, there’s no financial debt and Cash comprises 29% of Total Assets.
I know I’m contradicting myself having stated negative sentiment towards retail before, but this is eco yo and it’s growing hard.
Inter RAO Lietuva (Ticker: IRL PW)
Inter RAO Lietuva is listed in Warsaw Stock Exchange. I re-entered Inter RAO Lietuva in the end of September 2019 at average price of 12.83 zl. Current position performance in portfolio is +18.02%.
IRL PW Shares Historical Performance
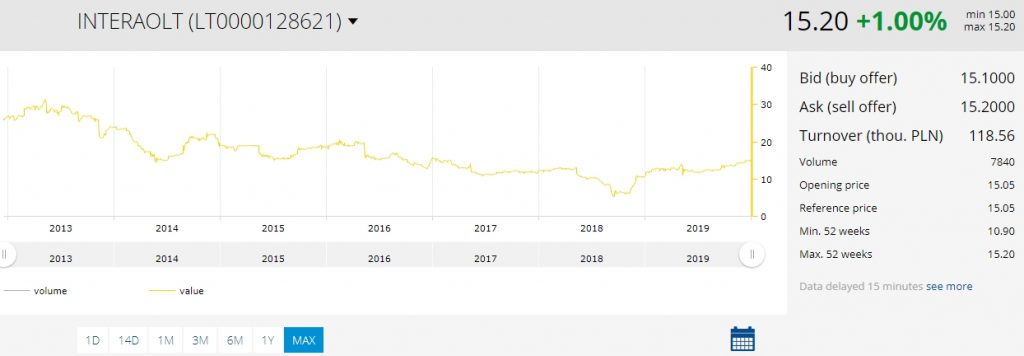
Current IRL’ Market Capitalization: 65.4 Million EUR.
Inter RAO Lietuva Facts in Numbers
IRL PW Financial Ratios
At 15.2 zl (4.24 EUR/PLN) last session closing price, current financial ratios and non-audited 2019 9M report for trailing twelve months figures are:
- EV/EBITDA: 2.8
- P/E: 4.11
- P/tBV: 3.16
- Debt/Equity: 1.24
- Net Debt/EBITDA: 0.61
- FCF/Market Cap: 19.21%
- Cash/Market Cap: 25.04%
Inter RAO falls off my casual equities screener and therefore there are no charts. Textual comparison 2019 9M ttm vs 2018 FY:
- Net Income is up +52% from 11.4 M to 17.4 M EUR;
- EBITDA is up +22.8% from 17.3M to 21.3M EUR;
- Current ttm forward dividend yield at usual 100% payout is 24.3%.
Commentary on Inter RAO Lietuva Financials and Position
I have written quite extensively about the stock here and here. So I won’t expand too much. There are reasons for this bargain.
Last year, the maximum price before ex-dividend date was 14zl. The day before 2018 FY report was published stock price was 12.05zl. That’s +16%. Today we are near the same setting a year later.
I will decide what to do with Inter Rao Lietuva position in the next 4 months.
Encana Corporation (Ticker: ECA)
My most recent addition to portfolio was in in November 2019 at the price of 4.68 USD. Current position performance (including dividend) in portfolio is +2.68%.
ECA Shares Historical Performance
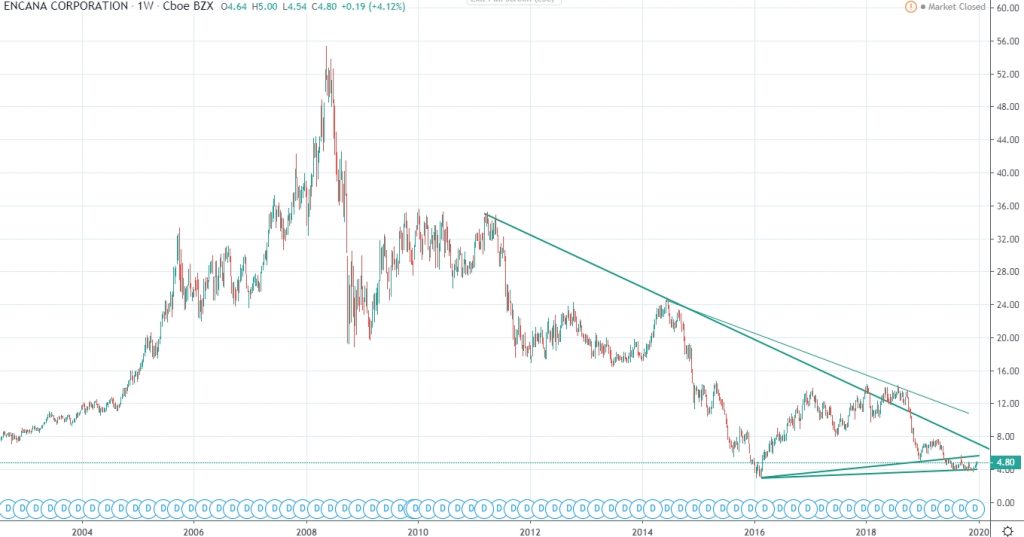
Current Encana Corporation Market Capitalization: 6.28 Billion EUR. Price did dip below 4 USD for several days, which I noted as a warning sign.
Encana Corporation Facts in Numbers
ECA Financial Ratios
At 4.80 last session closing price, current financial ratios and non-audited 2019 9M report for trailing twelve months figures are:
- EV/EBITDA: 3.77
- P/E: 4.95
- P/tBV: 0.86
- Debt/Equity: 1.15
- Net Debt/EBITDA: 2.99
- FCF/Market Cap: 5.6%
- Cash/Market Cap: 2.2%
Nothing new in western front since I last published the blog post, so for charts and extensive analysis please refer to the article on Encana Corporation.
Commentary on Encana Corporation Position
Important date to watch is Jan 14, when AGM will vote for corporate redomicile. One major shareholder Letko is about to vote against and there’s is some intrigue whether we lose one argument for holding the stock.
The rest still holds. Oil has made a move, which is a strong buy signal for Encana. It will be interesting to hear Q4 webinar. No plans to sell so far.
Finishing Word
Now I understand why I haven’t written more market or this stocks portfolio overview before. It took me 1.5 days to finish this overview but I’m glad I did.
Even though today counts 12’th year of my investment experience, as you can see I’m far from perfect in managing money. What I do know is I’m better than I was. With each new loss taken, with each new article, I publish.
Understanding own biases and ego is one of the greatest skills one can master.
Playing with money is the ultimate test ground for these skills. I hope you had some lessons as well, and if you didn’t you sure have a friend who would. We have to do something about financial illiteracy.
You can find all my portfolio actions explained here.



Leave A Reply