I’ll try to make it an annual tradition to review positions in equities portfolio at the start of the new year. This is the second issue of this format post. You can check review from 2020 here.
Year 2020 has been transformational for both – my mindset as an investor and my portfolio alike. I recently shared my learning in a blog post titled “Value Investor’s “Expensive” Fallacy“. What concerns portfolio, reading The Selling Blind Spot by Matt Joass really hit home and helped finally internalize a lot of mistakes I have been making. Mistakes, same as profit – compound over time.
For the longest time I was trapped in my own faulty decisions. It hurts ego to take a loss and admit you were wrong, wishful thinking kicks in and you are trapped in a position you don’t really like anymore. Finally 2020 was the year I acted with determination to construct portfolio I really liked.
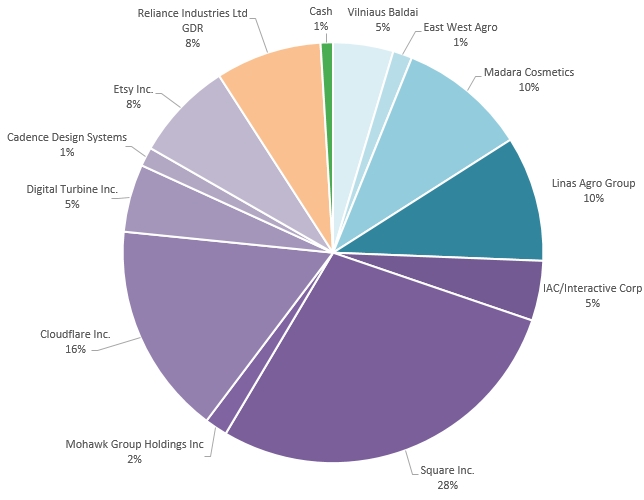
Current Stocks Portfolio Structure
This year was exceptional in number of orders made. I was switching trading brokerage, reshaping portfolio itself and on year end I made some transactions to optimize for taxable 2020. However I won’t delve into minute transactional details and will focus on current portfolio position’s performance, business and expectations going forward.
International readers will probably shrug at 2020 portfolio, because those nano caps in local market probably no-one outside Lithuania, Estonia and Latvia knows about. Local investors in Nasdaq Baltic following me on social networks saw almost finished year-long reconstruction portfolio to arrive at this (closing prices for Friday 2021.01.15):
So, around the clock, DJ, spin that shit.
Vilniaus Baldai (Ticker: VBL1L)
Oldest position portfolio purchased expecting fat dividend in 2017.06. If we exclude price rebasement of this year when switching brokerage. Current position performance including dividend is -12.33% or CAGR of -3.8%. Current position weight: 5%.
When switching brokerage I managed to gain additional 5% gain (buy lower on new brokerage, sell higher on old). From rebase in October end, taking accounting loss, VBL1L performance is +19.35% or +121.95% CAGR.
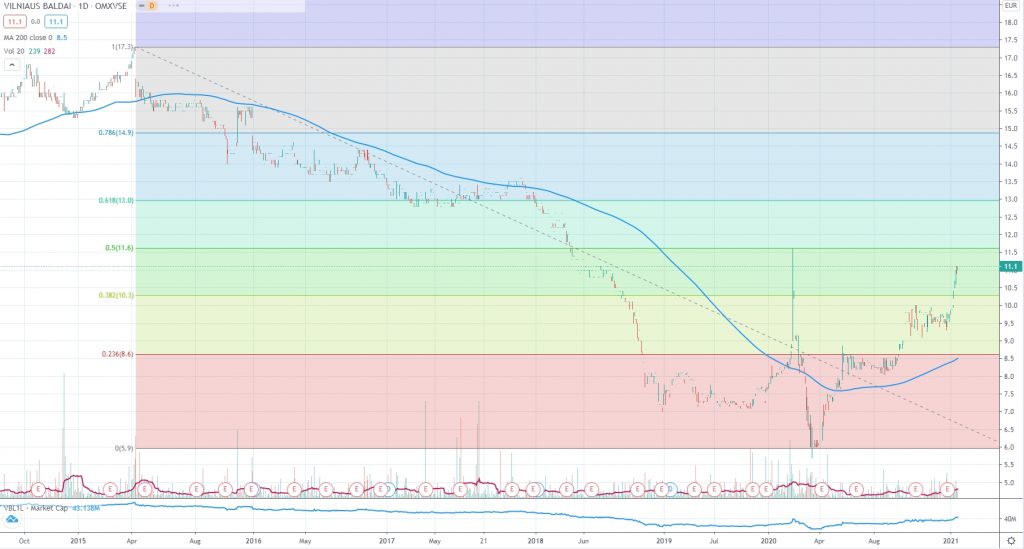
VBL1L shares historical performance
Don’t mind my Fibonacci too much. Current market capitalization of Vilniaus Baldai is 43.14 Million EUR.
Vilniaus Baldai Facts in Numbers
VBL1L Financials
At 11.10 EUR last session closing price current financials with TTM FY20-21 Q1 results:
- Revenues: +15% YoY;
- Net Profit: +19% YoY;
- EBITDA: +31% YoY.
Current EV/EBITDA: 4.54. Far for expensive.
Commentary on Vilniaus Baldai Business and Position
Growth momentum persists. However timber prices are recovering from COVID demand shock, which will eat on margins going further. Plant migration to Trakai seems to be going quite well.
As mentioned in last years review, trust takes time to recoup. Quite a lot of investors, including me, were disappointed in management’s ability to drive shareholder value. However I think given growth rate, current valuation stock is still lagging in Nasdaq Baltic Equities context. I don’t want to put a price tag nor the exit timeline, but I will leave this position eventually.
East West Agro (Ticker EWA1L)
Next old-timer. Position opened in January of 2018. Without price rebase, true current performance including dividend: -50.3% or CAGR of -27%. Current position weight: 1%.
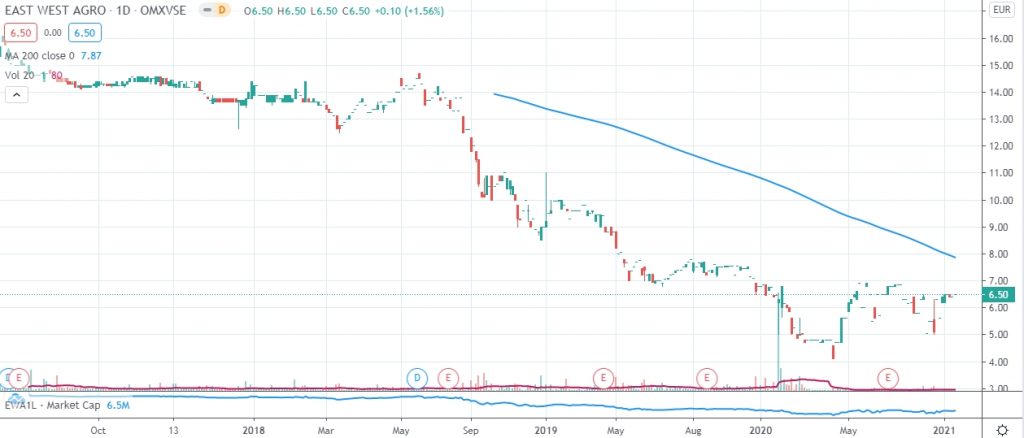
Current EWA1L market capitalization: 6.5 Million EUR.
Commentary on East West Agro Business and Position
Recently farmer’s budgets have improved significantly (pay-walled Lithuanian article), and investments into machinery are expected to rebound over next two years significantly.
Small, leveraged firm and under 3 consecutive years of bad weather in agricultural sector. That’s gotta hurt. Company privately issued bonds at >10%. That’s quite telling. I want to see FY20 audited report and based on market liquidity will look for exit.
Enough with the bloodbath already, huh?
MADARA Cosmetics (Ticker: MDARA)
I first formed Madara Cosmetics position in end of January 2019 (two years ago). Including dividend original current performance: +161% or +84% CAGR.
In process of switching brokers I again managed to gain additional profit in market and increased my position ~30%. New cost: 9.5 EUR formed in end of August 2020.
Accounting for taken profit, performance on new price base (no dividend yet): +110.5% or +559.9% CAGR. Current position weight: 10%.
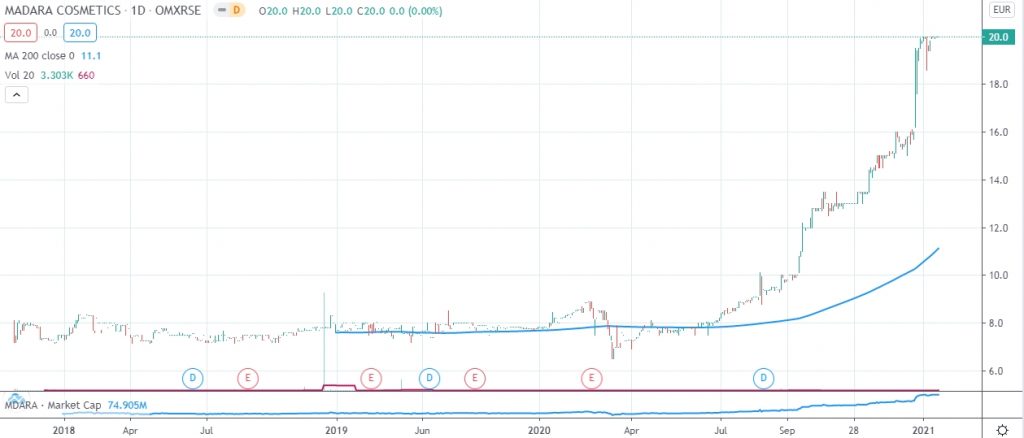
MDARA Shares Historical Performance
Current MDARA market capitalization: 74.9M EUR.
Madara Cosmetics Financials
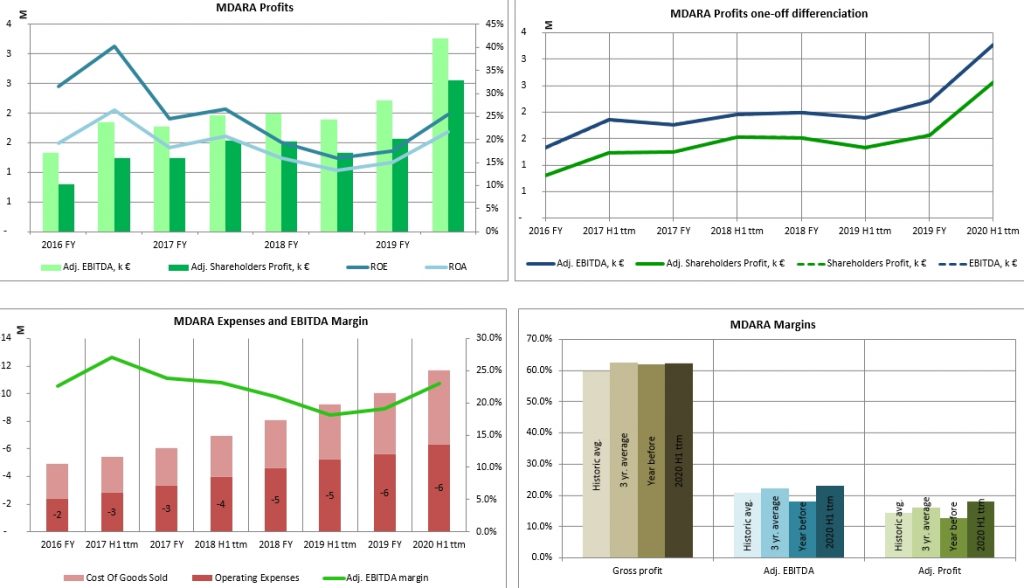
I have latest H1 TTM results only. And financial ratios are extended and not fully cover growth momentum in 2020 second half.
- 21 EV/EBTIDA;
- 29 P/E;
- 0.16 Debt/Equity
- 25.4% ROE
- 7.4% Cash/Market Cap.
Madara Profits, Expenses and Margins:
Commentary on Madara Cosmetics Business and Position
I covered Madara Cosmetics H1 results in a twitter thread:
After then quite a few investors seem to have realized what this company is about and what the future will look like. Welcome.
Company reiterated it will beat 2020 15M Revenue guidance and aims to growth revenue at 20% to get to 27M revenue by 2023 (announcement). Plenty of things to be happy about. Most of which were named when I first formed a position.
- Creating new product lines;
- strong secular trends in ecology/organics;
- growing brand awareness;
- strong balance sheet;
- high return on capital;
- family business. Owners-operators;
Only criticism I might have is cash allocation is very conservative and it’s been historically so, higher growth rates are theoretically possible.
Still a lot of growth ahead business wise, but stock has been pretty far forward looking recently, atypically for most Nasdaq Baltic stocks.
Linas Agro Group (Ticker: LNA1L)
I had sold this position in 2020, but news on KG Group acquisition prompted me to act quickly. I re-entered stock at 0.59 in morning of announcement and later increased my position 30% at 0.64 EUR.
Weighted performance so far is: +27.0% or +216.1% CAGR. LNA1L weight in portfolio: 10%.
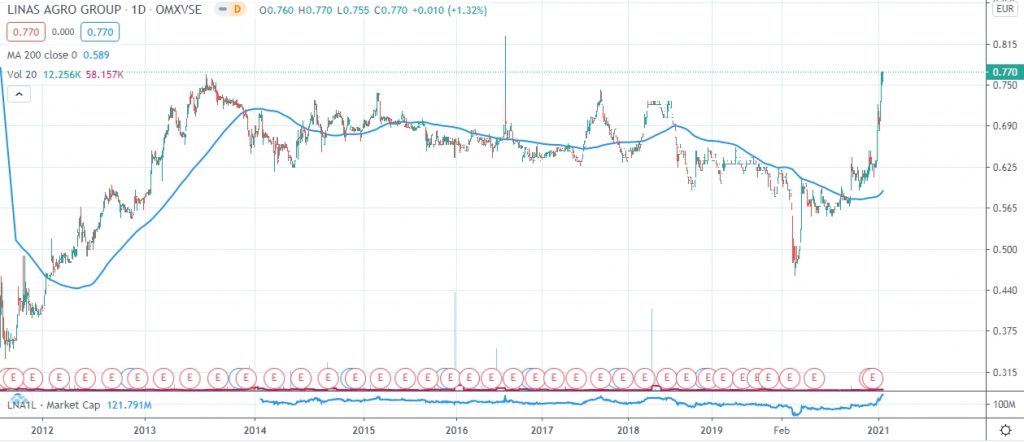
LNA1L Shares Historical Performance
Current LNA1L market capitalization: 121.8 Million EUR.
Linas Agro Group Financials
My data is lagging one quarter. For FY19-20 finished in June 30 and current 0.77 EUR price:
- 12.9 EV/EBITDA;
- 29.3 P/E;
- 0.7 P/tBV.
- FCF/Market Cap 24%.
FY20-21 Q1 (announcement):
The gross profit reached EUR 13.2 million and was 26% higher than a year before. Consolidated EBITDA was 92% higher and amounted to EUR 9.2 million. The operating profit was EUR 4.9 million or 260% higher.
Profit before taxes amounted to EUR 4.5 million against EUR 0.9 million in previous year. The net profit attributable to the Company went up from EUR 0.6 million to EUR 3.9 million.
Commentary on Linas Agro Group Business and Position
Main points were given in Twitter thread when I increased my position. (open to view all thread)
In conference call with Investors’ Association LNA1L executives have made a remark, that fair value of Linas Agro Group stock is around 1 EUR. (+30% upside). I think that’s still conservative, given all that’s been happening in the group.
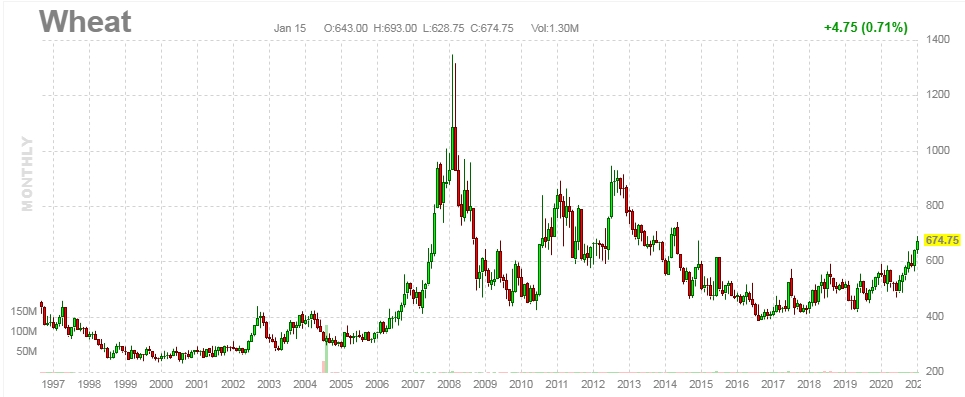
Wheat prices are on the rise, that should help too.
I owned this company from 2013 previously. I know it’s business fairly well, had several discussions with management, I’m comfy in their capital allocation and business strategy they are executing. KG Merger price is still unknown but I have trust in management.
Position among growth stocks might come as surprise, but LNA1L is like a sanity damper (not used to stocks growing multiple times in my portfolio) and true value stock I will only sell under exceptional conditions going forward. Land sale mentioned in twitter thread is a peek into its deep value.
On a side note: from 2012 free float has been reduced -22.2%, mainly by owner and main shareholder Darius Zubas and his controlled entities.
Leaving Baltic sea waters…
IAC/Interactive Corp. (Ticker: IAC)
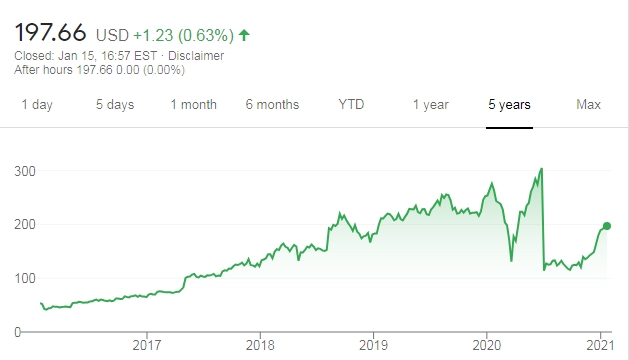
Most recent purchase (January 4, 2021) at 193.52 USD. Current performance: +0.21%. IAC position weight in portfolio: 5%.
IAC Shares Historical Performance and Business Model
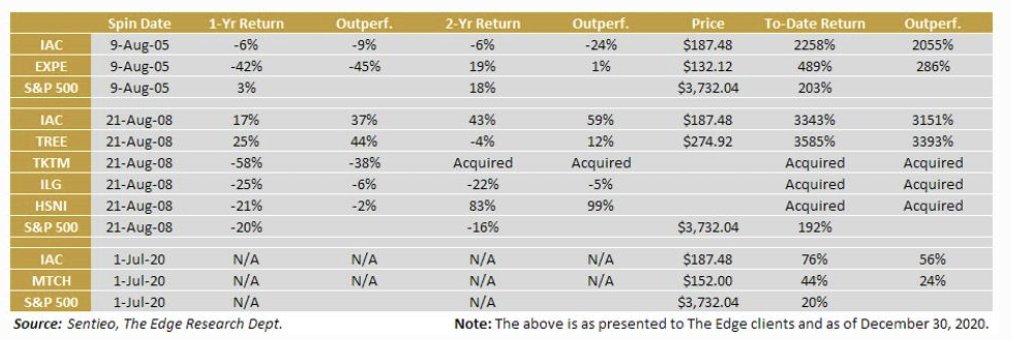
It’s a bit tricky to analyze it, because of its model “Be a conglomerate and an anti-conglomerate”. They breed internet native businesses and then spin them off. Jerry Cap recently had a nice graphic on historic spin-offs from IAC:
That’s an impressive track record and proof of management capital allocation and business operating skills.
Price history on trading view is cut at recent Match Group spin-off (on below chart 300 -> 130 correction. Investors who held IAC, got Match Group (Ticker: MTCH) into their portfolios automatically.
Current IAC market cap: 16.9 Billion USD.
IAC/Interactive Corp Financials
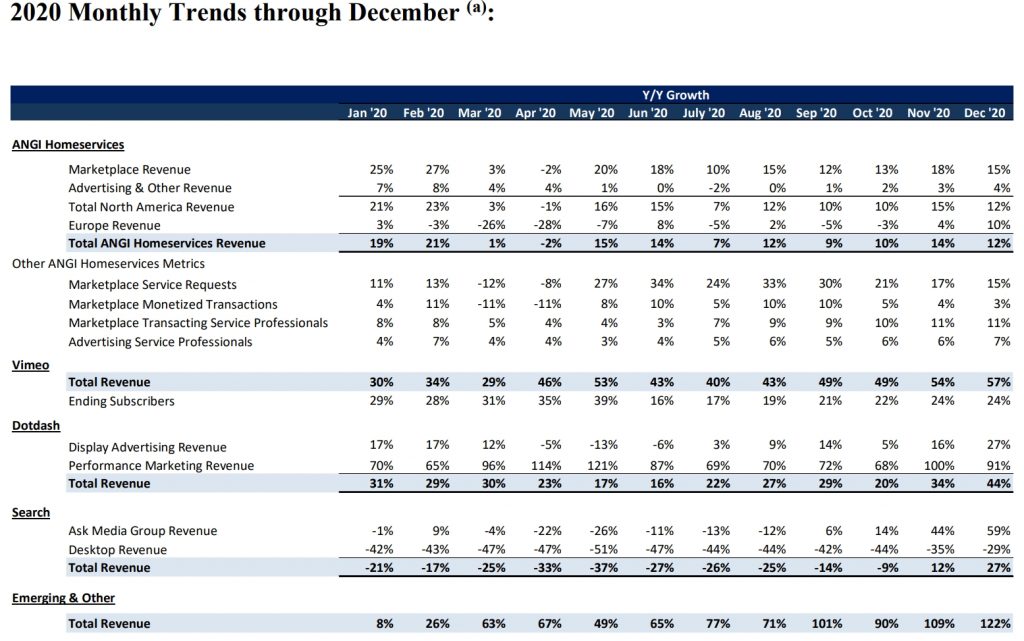
Fun part: Growth rates.
2020 Q3 financial results:
As of 2020 Q3 it had 3.8 Billion cash (22.5% market cap) waiting to be deployed.
Abstract IAC Thesis
Due to lack of time, I never explained even on social media why I got into this stock. I tracked this stock for at least half year, but I was busy (believe me) analyzing and forming positions in other stocks. In the meantime, IAC announced it would spin-off Vimeo. Stock jumped +14% on the same day.
Vimeo is an excellent business in itself, growing at 50%+ rate. Pure B2B SaaS, high gross margin business is a cake to current market environment. I want an early exposure to that.
IAC purchased 12% shares of MGM resorts in open market during the very bottom in Covid crash. Talk about capital deployment skills. CEO Joey Levin and Barry Diller (Respected industry veteran, founder of IAC) joined MGM’s board and will work to modernize and push rich MGM infrastructure to become solid online betting player at a fraction of peer valuations.
On Angi Homeservices front that’s a solid and growing business I pleasantly was surprised to read on Umbrella acquisition.
Dotdash got the management it deserved and it’s a business that rose from ashes. Visited Investopedia? You were on IAC territory.
Commentary on IAC Position
I would like to think it’s a starter size position, but I lack liquidity to increase my position more substantially. Exceptionally excited about Vimeo and MGM stake opportunity. Modern misunderstood value stock (keep learning my self).
Square Inc (Ticker: SQ)
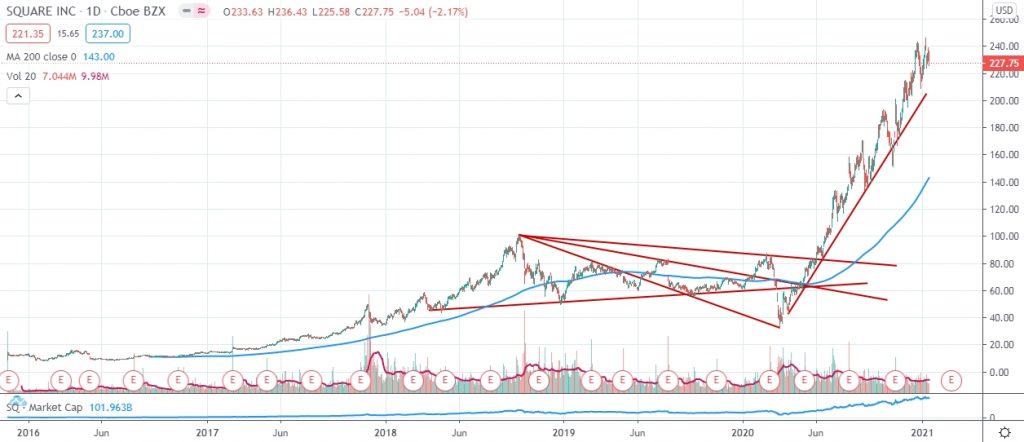
I started forming position in 2020 May at 68.85 USD and ended at start of 2020.07 at 128.48 USD. Weighted performance is: +118.1% or CAGR of +252.8%. Square weight in portfolio: 28%.
SQ Shares Historical Performance
Current Square market capitalization: 101.9 Billion USD.
Commentary on Square Inc. Business and Position
Because of high weight in portfolio, I cover SQ in twitter threads quarterly. Latest Q3 financial review:
Generally all points written several months ago in SQ thesis are still valid, but I think market conditions were very accommodative so far. I expect:
- lower returns going forward;
- stable above water profitability;
- challenges with CBDC’s (I estimate we have around 2 years left in US market), but I don’t want to share my worries publicly for now);
- exceptionally strong Q4, which would pave the way for 300 price target in second half of 2021.
Depending on market environment, SQ results, liquidity needs, I may trim position to ~20-25% weight.
Mohawk Group Holdings Inc. (Ticker: MWK)
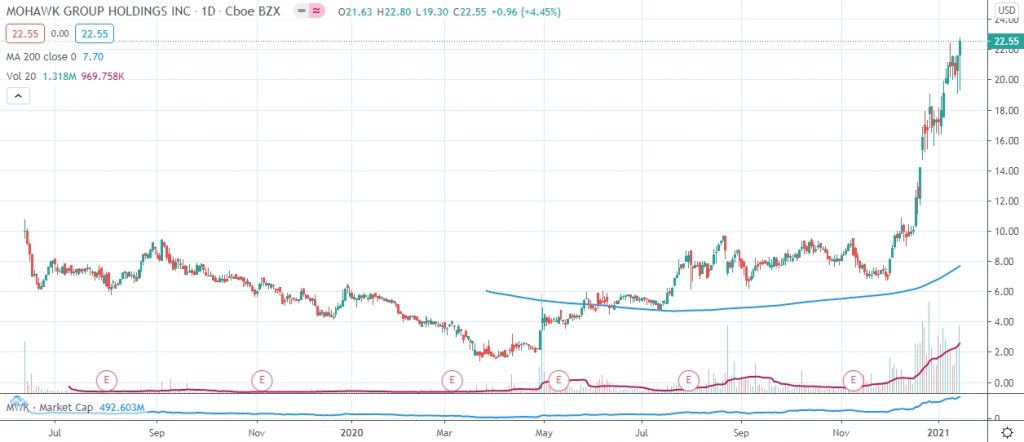
In last days of 2020 I entered MWK at 16.75 USD. Current performance: +31.87% or #### in CAGR terms (excel fun, we understand it makes little sense). Weight: 2%.
MWK Shares Historical Performance
Current Mohawk Group Holdings market cap is 492.6 Million USD. Still a baby, considering growth rates and potential.
Commentary on MWK Business and Position
I wrote a twitter thread on Mohawk and in 2-3 weeks not much has changed.
It’s actually a high conviction stock for me, and natural question arises, why only 2% exposure? Lack of liquidity. Why not exit EWA1L and put it into compounder like MWK? I also have internal limits for USD (and US market/economy in general for that matter) exposure.
Co-founder in another twitter thread has noted growth rates might jump to as high as 100%. Street could get erratic.
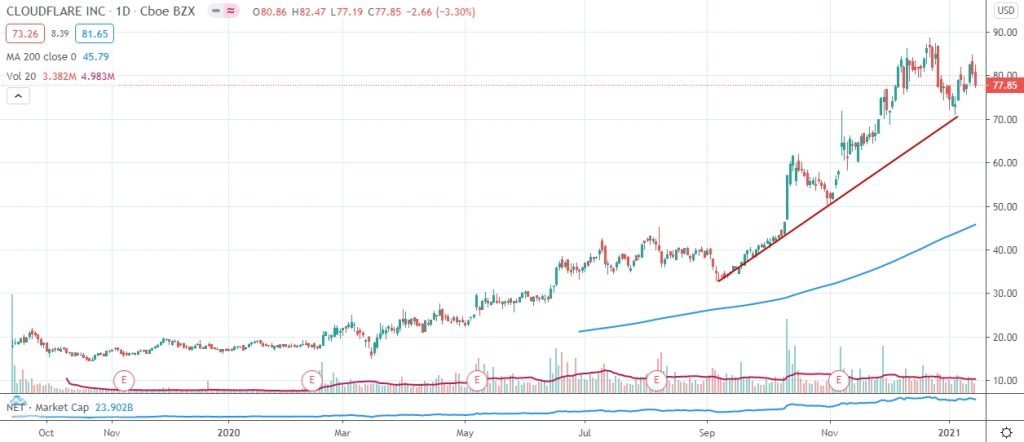
Cloudflare Inc. (Ticker: NET)
On last days of 2020 I took taxable profits to cover realized losses. Originally I entered Cloudflare in late August and start of September at 38.36 and 35.91 respectively.
Fixed weighted profit in last days of 2020: +96.4% and CAGR of +657.1%. Rebasing cost price higher and increasing position size 170% at weighted average cost: 80.52 USD. Rebased position performance: -5.2%. Cloudflare weight: 16%.
Cloudflare Shares Historical Performance
Current Cloudflare market capitalization is 23.9 Billion USD.
Commentary on Cloudflare Business and Position
Valuation is excessive, there’s no doubt. Not a Snowflake level, but 61xSales takes into account quite a lot of upside for now. Problem is: you never know what Cloudflare will announce next. Their pace of innovation in second half of 2020 was something extraterrestrial.
In numerous interviews, social conversations, conference calls, podcasts I feel like I have an idea what Cloudflare is trying to do and how are they are going to get there. I feel very confident in Matthew Price his co-founder Michelle Zatlyn moral integrity. Their business strategy serving all clients no matter the size (as opposed to Fastly) has already proved to be superior. Evolving to become a one-stop solution for IT departments, from security to performance.
Customer obsession (often developer in this case) is very familiar to Bezos vibes. We know how that ended. Cloudflare is developing cutting edge internet technologies and voluntary fixing internet infrastructure without any financial benefit. And I believe that matters.
For those that are not afraid to get their hands dirty: Cloudflare explained.
Never sell type stock. Too early, potential too big.
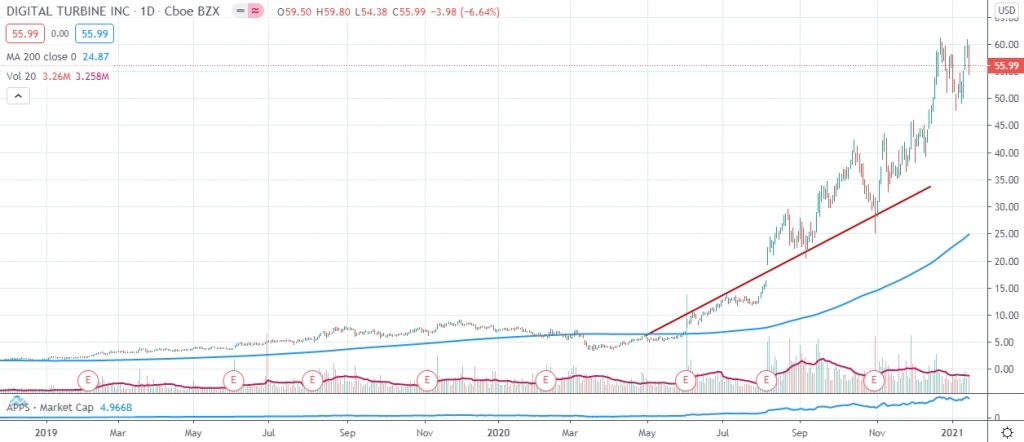
Digital Turbine (Ticker: APPS)
Entered a stock for Q3 results, but stayed and increased position, when price retracted from new highs. First entered on end of August at 25.76 USD, added November start at 30.12 USD.
Current weighted performance: +90.5%. CAGR: +991.5%. Digital Turbine weight in portfolio: 5%.
Digital Turbine Shares Historical Performance
APPS market capitalization currently is: 4.9 Billion USD.
Commentary on APPS Business and Position
Company is an advertising platform in-between OEM/Telecoms and advertisers. There’s a huge competition for app downloads and overall user eye-balls. Advertisers pay Digital Turbine for their apps to be pre-installed in factory.
Acquisition of Mobile Posse will enable to monetize devices throughout device life-time. Which is a huge thing. More on Digital Turbine, if you are interested.
Growth is .. +116% in revenues, oh and it’s GAAP profitable, growing cash machine, so I have to hold my contempt for advertising and hold onto this for a while.
Cadence Design Systems (Ticker: CDNS)
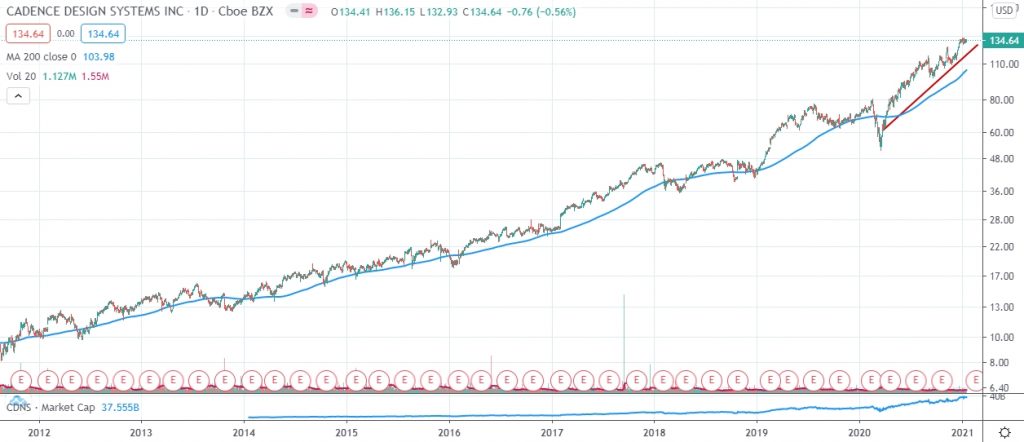
In hopes of adding in the future I initiated starter position in CDNS in mid September at 99.48 USD. Current performance: +30.75% or +124.5% CAGR. Unfortunately Future never came. Yet. Current CDNS weight: 1%.
Cadence Design Systems Shares Historical Performance
That’s an obvious compounder right here. Note, chart is in log scale.
Current market capitalization for CDNS is: 37.56 Billion USD.
Commentary on CDNS Business and Position
Another sleep-well owning stock. Picks and shovels in growing semiconductor industry. Company sells licence’s to its electronic design automation software (EDA) and creates it’s own IP portfolio, which is even higher margin. Most of revenues are recurring. Cash flow machine does share-buybacks strategically, which helps form the chart above.
Incredibly grateful for Andy, who introduced Cadence to my watchlist in mid 2020.
- secular growth sector;
- defensive sector in fact;
- R&D spend in semiconductor is last section in P/L that’s touched in market downturns;
- growing IP portfolio, contributing to margin expansion;
- highly, Highly profitable;
- Trusted CEO, industry veteran Lip-Bu Tan.
Would love to increase CDNS position anytime.
Etsy Inc. (Ticker: ETSY)
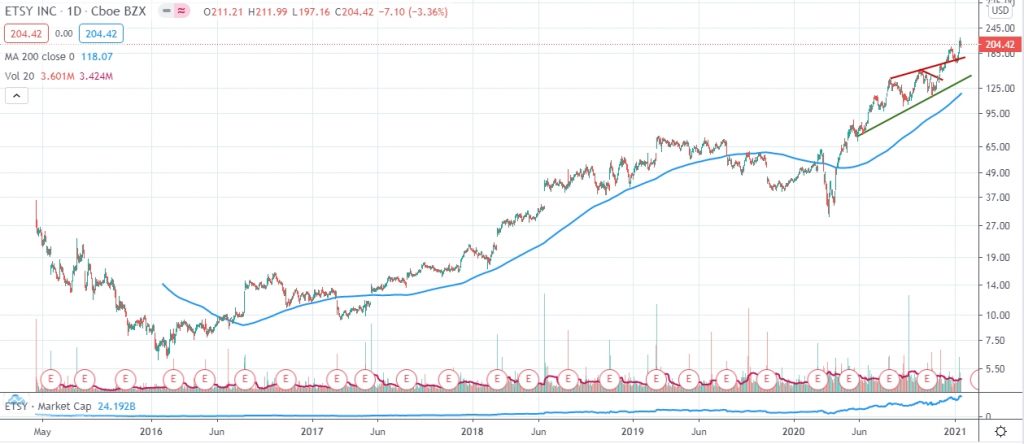
Started forming Etsy position in start of October, ended a month later. Weighted average performance so far: +47.8% or +559.4% CAGR. Etsy weight in portfolio is: 8%.
What does strong conviction look like?
Etsy Shares Historical Performance
Current Etsy market capitalization: 24.2 Billion USD.
Commentary on ETSY Business and Position
Looking back I was right about wrong timing to enter, but nonetheless… You never know. I wrote about my decision in another thread.
Recent daily +14% jump was due to this Etsy blog post release, where investors get a sense of growth rates in Q4.
1,183% increase in searches on Etsy for cocktail DIY kits*, while searches for baking, cooking and other food-related DIY kits have increased by 165%
In another paragraph:
[…] 45% increase in searches on Etsy for zodiac necklaces* and a 440% increase in searches for birth flower jewelry*. Wellness gifts have also remained popular, as shoppers seek out ways to step away from their screens, relax, and reset for the year ahead: we’ve seen a 48% increase in searches on Etsy for notebooks, journals, or diaries and a 163% increase in searches on Etsy for bath bombs or bath salts
So a timely entry.
I may opportunistically raise cash after Q4 release, after all, it was a Q4 earning play. Not sure, depends on a lot of details though.
Reliance Industries (Ticker: RIGD)
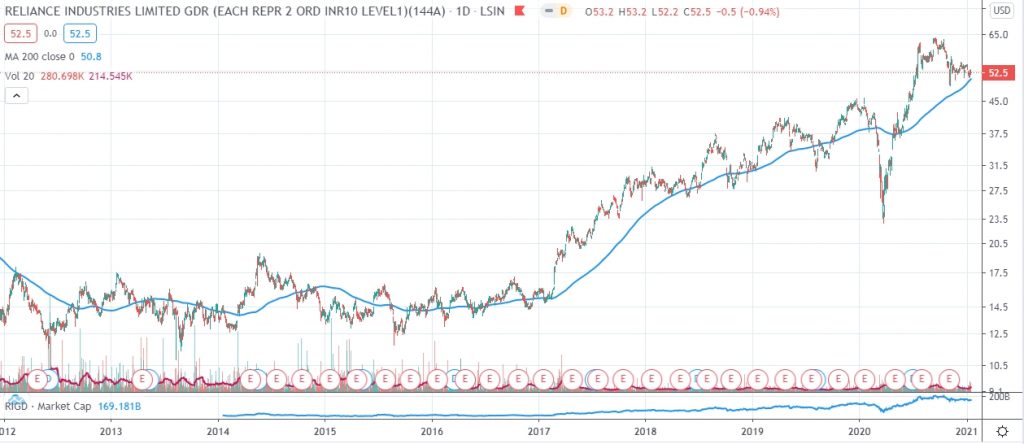
Details of Reliance Industries position cost and purchase dates in this blog post. Weighted current performance: -16.3% or -50.9% in CAGR terms. Reliance Industries weight in portfolio: 8%.
Reliance Industries Shares Historical Performance
Current market capitalization of this giant is: 169.2 Billion USD.
Commentary on Reliance Business and Position
Just as a reminder, I wrote about Reliance in this blogpost:
Q3 results showed a significant slowdown in Jio Platforms user growth (+1.8% growth 405.6 Million users), overall last quarter results were not strong either.
- Revenue -23% YoY;
- Net Profit -6.6%.
Optimism in Reliance Retail and Jio Platforms (obvious growth segments)
| QoQ change | Jio Platforms | Reliance Retail |
| Revenue | +7.1% (1.1 Billion USD) | +30% (5.6 Billion USD) |
| Net Profit | +19.8% (409 Million USD) | +125.8% (132 Million USD) |
Another thing weighting on Reliance is unending farmer protests in several Indian regions. Farmers claim new regulation over the long term will help create corporate price dictate on crops (RIL).
Indian growth is a no-brainer. Eventually Reliance will catch up. It’s also an important diversification in region/economy, even though most of things are highly connected and correlated.
Additional Commentary
Harju Elekter (HAE1T) Exit
When I sold HAE1T, I originally planned to re-enter at provided price point. I actually had an opportunity to do that within +/-0.02 EUR range, but did not. More intense work days, had attention elsewhere and I think subconsciously I was moving away from Nasdaq Baltic already.
But I never disclosed final position result. So here it is: -12.2% or -6.1% CAGR. As of today, position would be above water.
Harju Elekter is actually one of few plays in EU “green” money fountain through its’ Skeleton Technologies. Skeleton will play a critical role in EU car manufacturers trying to catch up with Tesla. However this play via Harju Elekter is now diluted to only ~4% stake after last round of funding (uncertain about exact figure).
Cash position
I currently use two brokers, one of which is just my casual bank account, where cash is a mix of “portfolio cash” and daily expenses cash, which makes drawing portfolio cash position an imaginary excercise.
I have been “stacking sats” in Bitcoin CFD throughout 2020 in Revolut account. Currently I own some Bitcoin CFD as well, which is not accounted in Equities pie chart, but could be pulled at any time.
It’s a stoks portfolio and transactions related to equity buys / sells should be taken in broader context.
Currently, what concerns equities portfolio cash position, I’m temporarily about 4-5% in debt.
Where’s Overall Portfolio Performance?!
I don’t like this figure. I look at:
- individual stock performance (what we went through in this overview) which emphasizes in more detail what went ok, and what went bad and most importantly why. Position sizing, broken thesis, correct thesis, market sentiment, macro drivers..?
- overall personal wealth across all asset classes, which I have chosen early on not to disclose.
Besides the points made in commentary on cash position, I also earn and invest “fresh money” which further distorts annual return figure.
All that said, 2020 YoY equities portfolio grew around +59% (+7% in 2019). As mentioned in recent post on high-growth stocks, I have no illusion – my returns were driven by macro environment. Let’s give portfolio more years before claiming some personal credit on stock picking skills. See you around!







2 Comments
Super. Keep going. You are one of my favorite. Like Baltic Nasdaq market. Madara Cosmetics jump 20% these week. Crazy
Thank you! Madara is suffering from liquidity crisis. This is favorable for current shareholders, because noone is willing to sell. However after today’s move I’ll consider reducing and allocating to higher potential stocks.